
I’ve been working on a side project to help track utilities usage around my house, to help us conserve water and electricity and quantify how much we are using on a day-by-day basis. Since our water/power companies’ smart meters broadcast their usage stats unencrypted on ~900MHz, we can use a program to decode their packets using a software-defined radio. There’s a project on github https://github.com/bemasher/rtlamr which has most of this functionality already written. We just need a way to pipe those numbers into a dashboard to view.
Process
First, I installed prometheus and Grafana on a Raspberry PI. I’m not going to detail those steps here - but I installed prometheus via the raspbian apt package manager, and grafana after adding it’s repository.
I wrote a script available on my github (https://github.com/richinfante/powermeter), which manages the rtl_tcp and rtlamr processes and writes a file for prometheus.
Tweaks
If using a raspberry pi (as I did), customization may be required. If running the scripts prints a lot of messages like ll+ now ${number}, try editing the script to call rtl-amr with a different set of arguments. Changing the msgtype to scm,r900 (or limit to the specific protocols you need for your meters), can reduce the amount of processing needed to reliable parse messages. Some people have had success with changing the symbol length.
On my raspberry pi 4 (4gb ram), the following code works for my electric and water meters:
# edit this line inside the powermeter.py file to customize the protocols you want to recieve
self.amr_proc = subprocess.Popen(
  ["rtlamr", "-format=json", '--msgtype=scm,r900'],
  stdout=subprocess.PIPE
)
I was able to get a Pi 3B+ to run the powermeter scipt, but only with the SCM protocol enabled.
Grafana charts
It’s out of scope for this post, but it’s relatively easy to set up some nice visualizations in Grafana once the data is flowing:
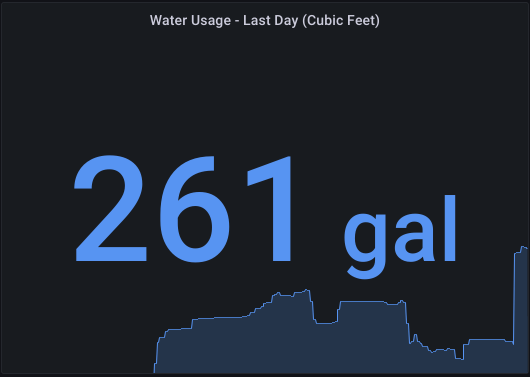
Then, we can use a query inside grafana in order to read the meter’s contents. Mine is off by a factor of 100, so I divide to get the actual usage in cubic feet:
meter_consumption{meter_id="METER_ID_HERE"} / 100Resetting the USB automatically
Sometimes, this script runs into an issue where the rtl_tcp program times out and seems to not be able to connect to the SDR.
I believe this is caused by an SDR that is potentially failing. I Run this 24/7, and have been running it for over a year as of this update (Feb 2023).
I found this tip online (I cannot find where it was, may have been something on StackOverflow)
If we tell raspbian to reset the device, things auto-magically work again. This should be available on most linux distributions:
/usr/sbin/usb_modeswitch -v 0x0bda -p 0x2838 --reset-usbWe can find the arguments for -v (vendor ID) and -p (product ID) by running lsusb. For RTL-SDR sticks, chances are they match the one below:
Bus 001 Device 003: ID 0bda:2838 Realtek Semiconductor Corp. RTL2838 DVB-TI put the usb_modeswitch command above in my crontab to run on a schedule so that if something crashes, it will reset itself once a day.